Below is a chart that shows the distribution of delegates that have historically attended iDate Agency Conventions.
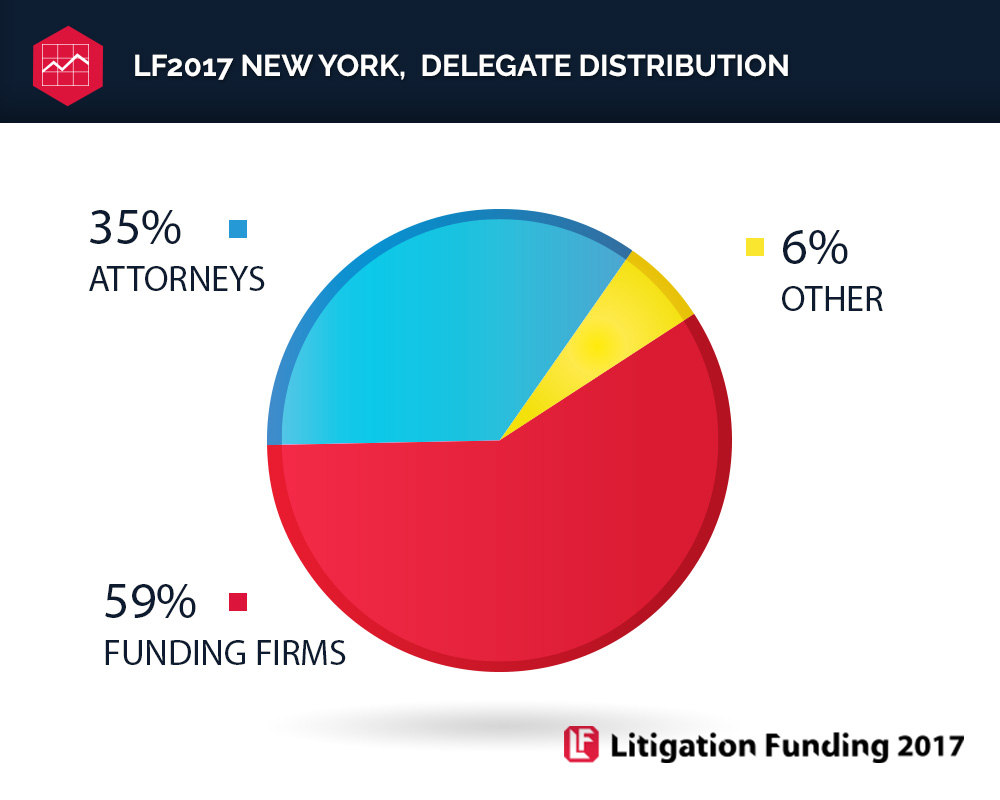
Note: The distribution is fairly consistent at all iDate Agency Convention events.
Below is a chart that shows the distribution of title/position of delegates that have historically attended iDate Agency Conventions. The vast majority of delegates are senior executives from the firms they represent.
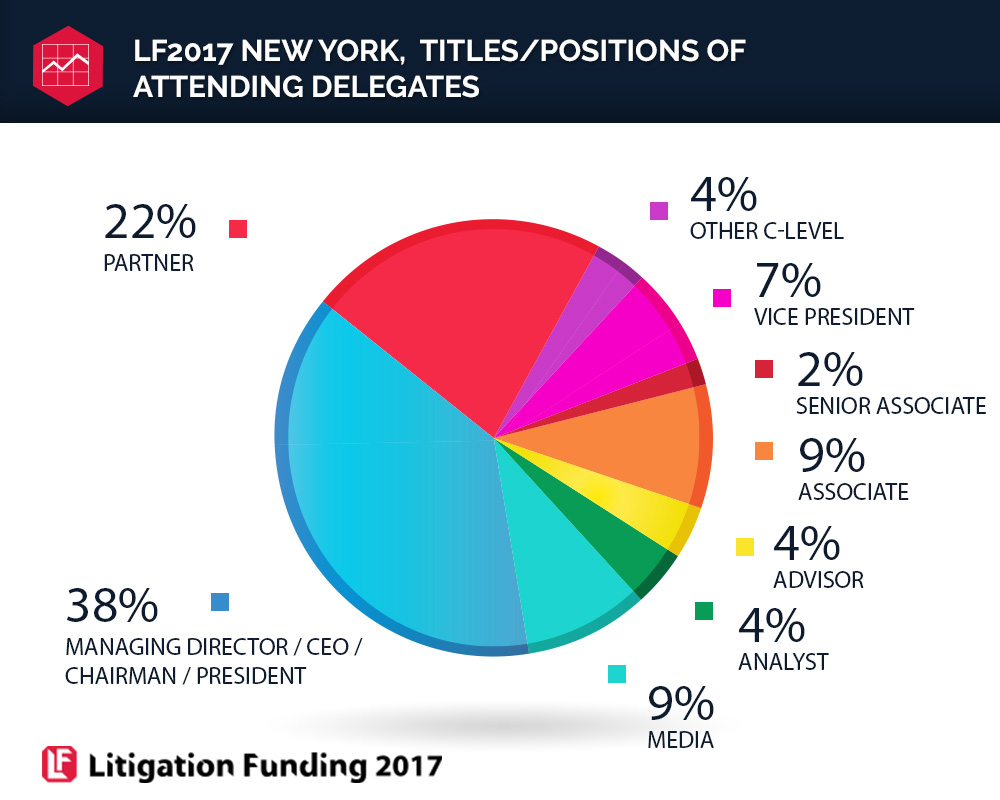
Note: The distribution is fairly consistent at all iDate Agency Convention events.
Below is a chart that shows the types of delegates that have historically attended iDate Agency Conventions.
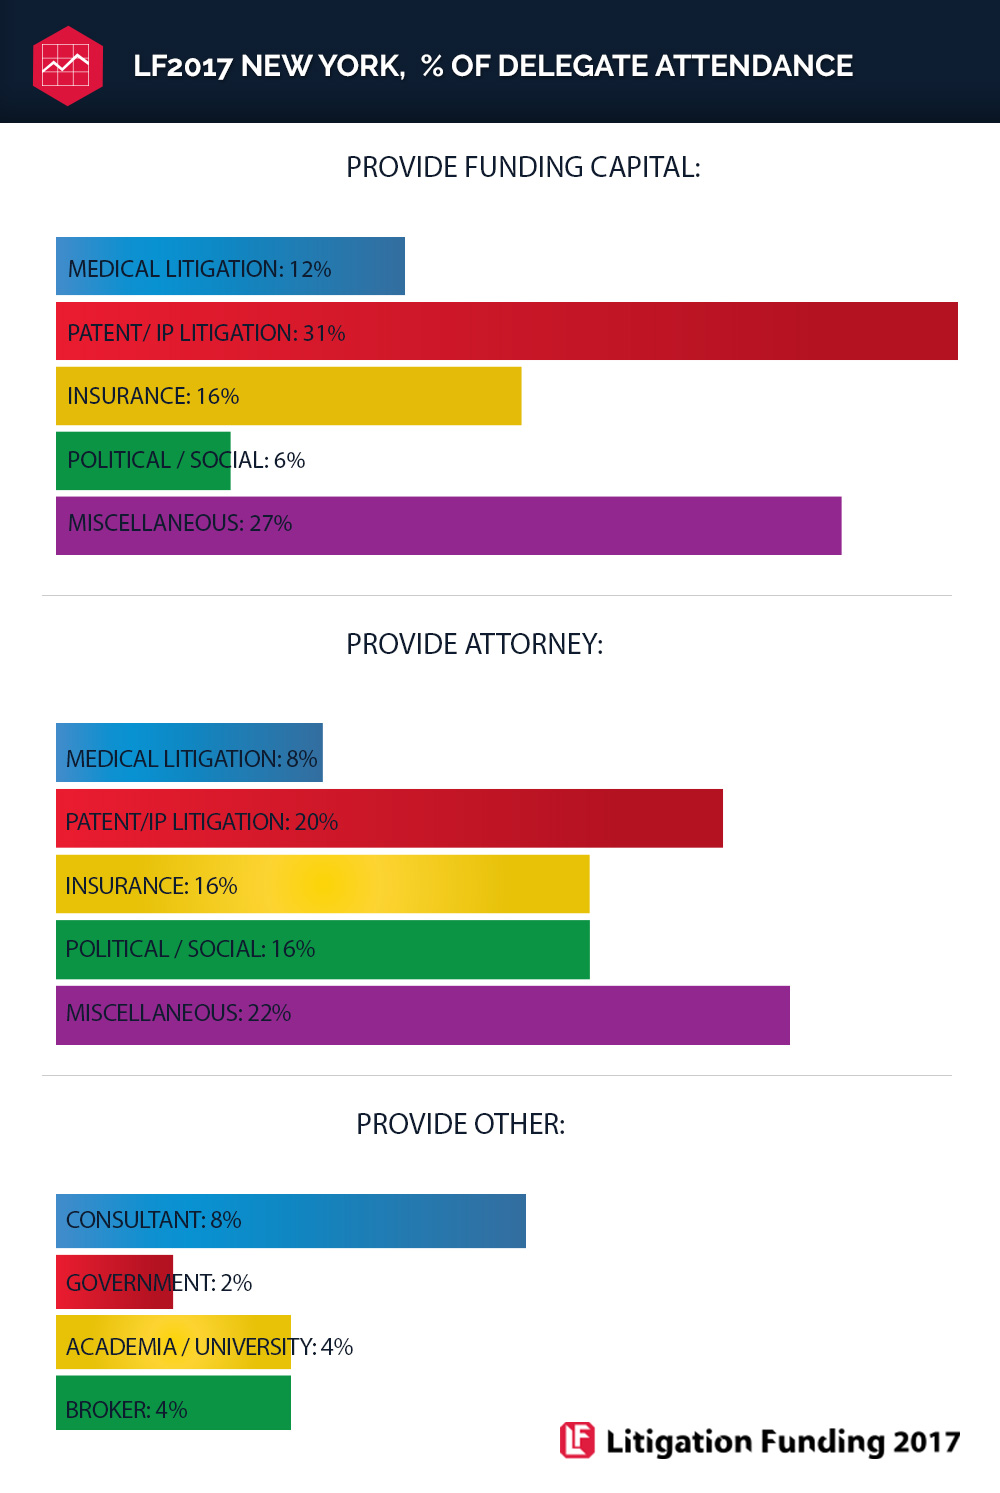
Note: The distribution is fairly consistent at all iDate Agency Convention events.
Below is a chart that shows the iDate Agency Convention overview based on delegates' feedback.
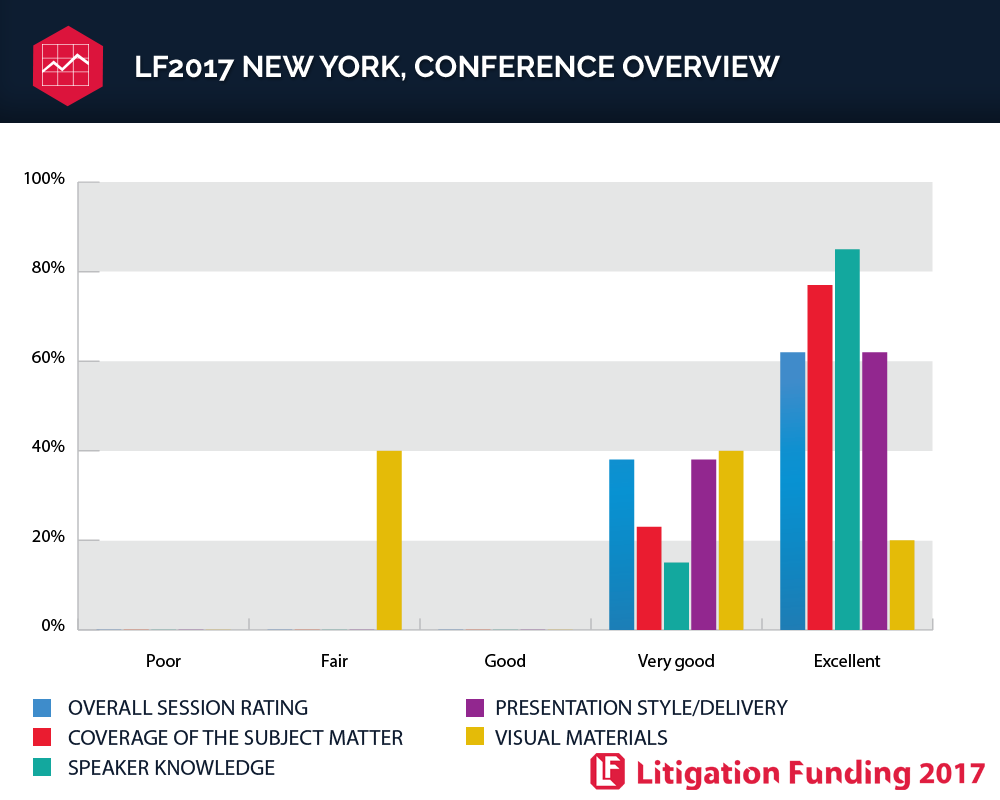
Note: The distribution is fairly consistent at all iDate Agency Convention events.
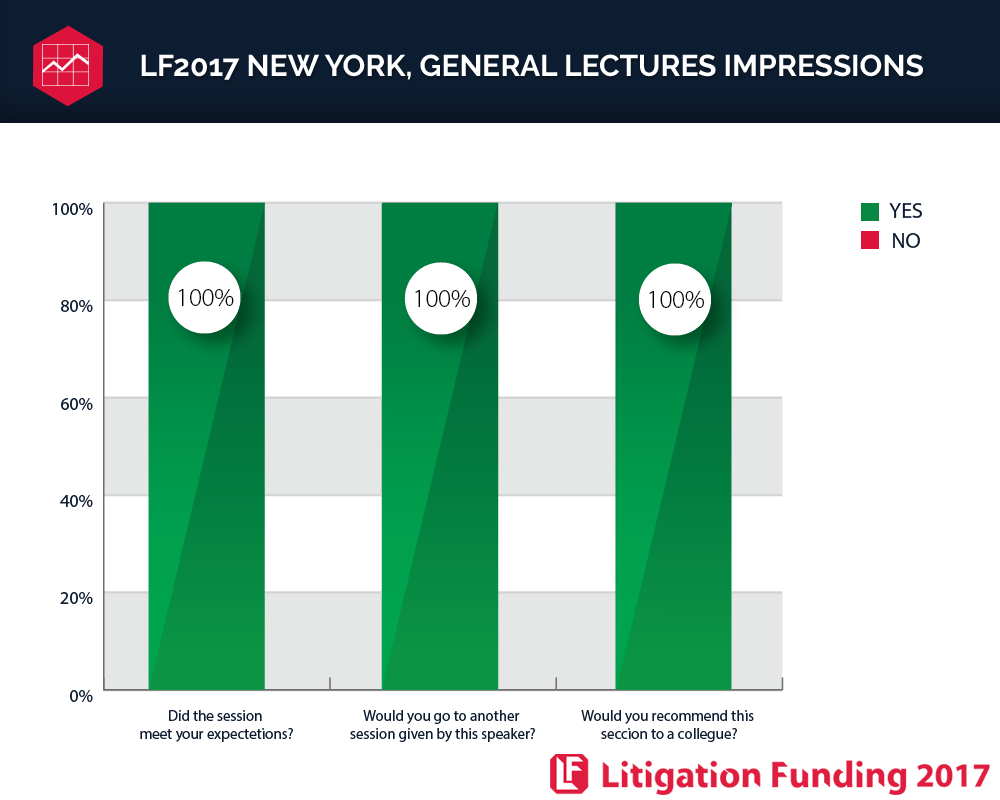
Below is a comparison chart of the delegate expectations and recommendations from iDate Agency Convention in New York (2017).
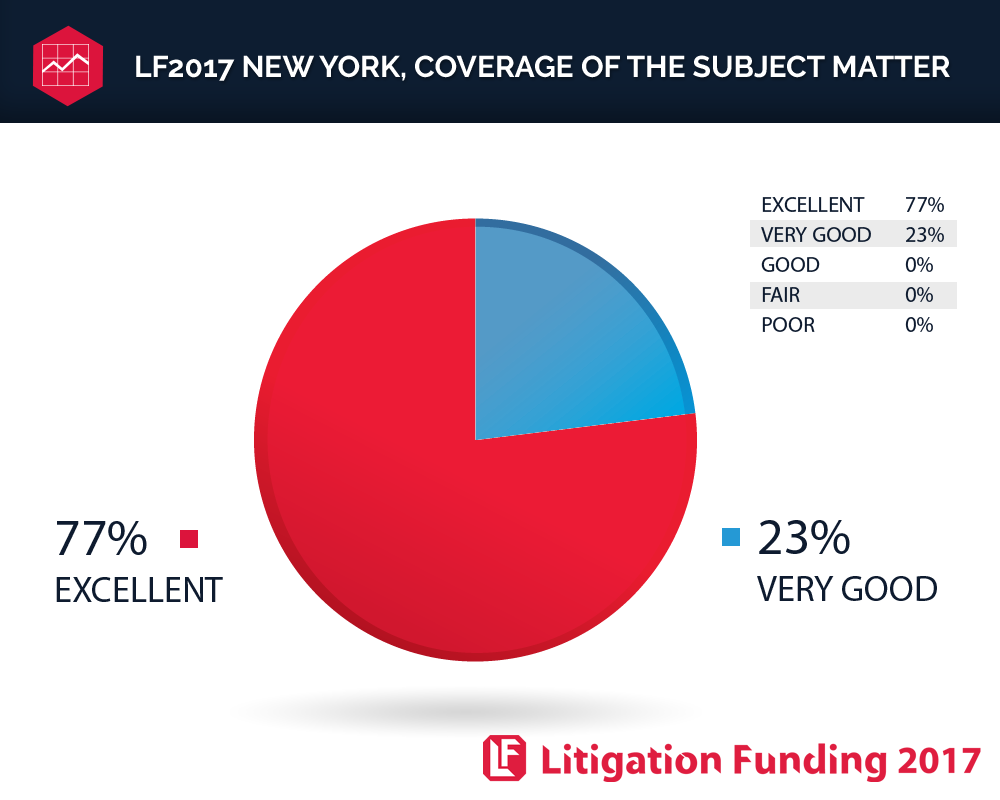
Below is a comparison chart of the coverage of the subject matter voted by delegates at iDate Agency Convention in New York 2017.
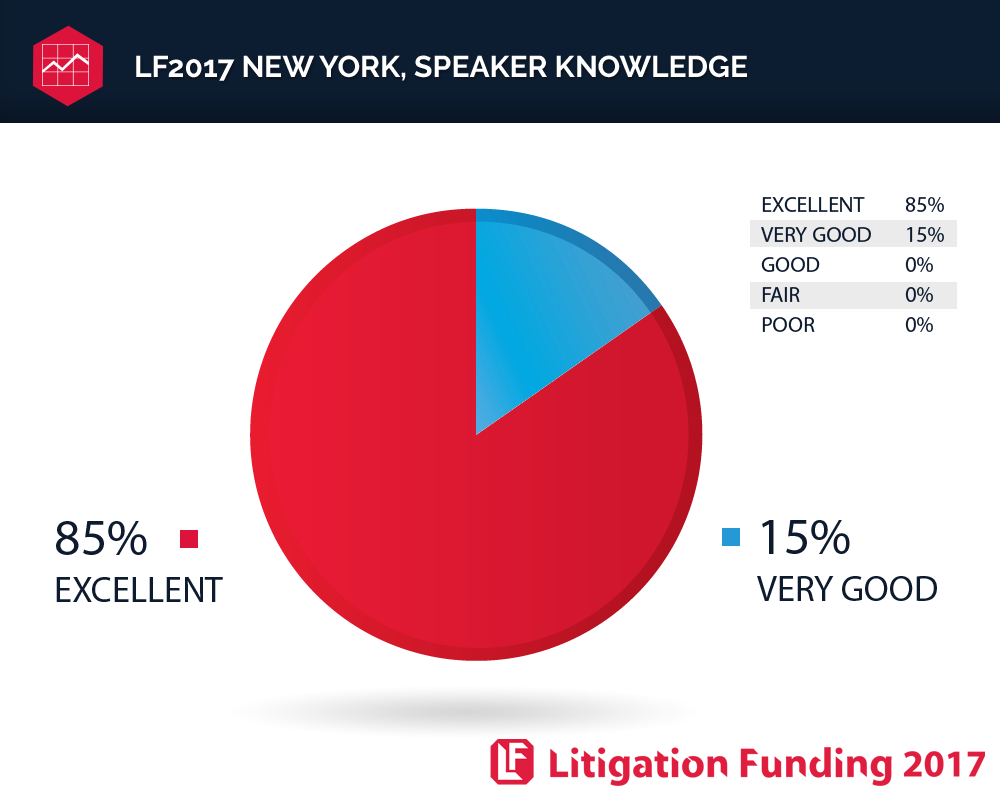
Below is a comparison chart of the speaker knowledge ratings voted by delegates at iDate Agency Convention, New York.
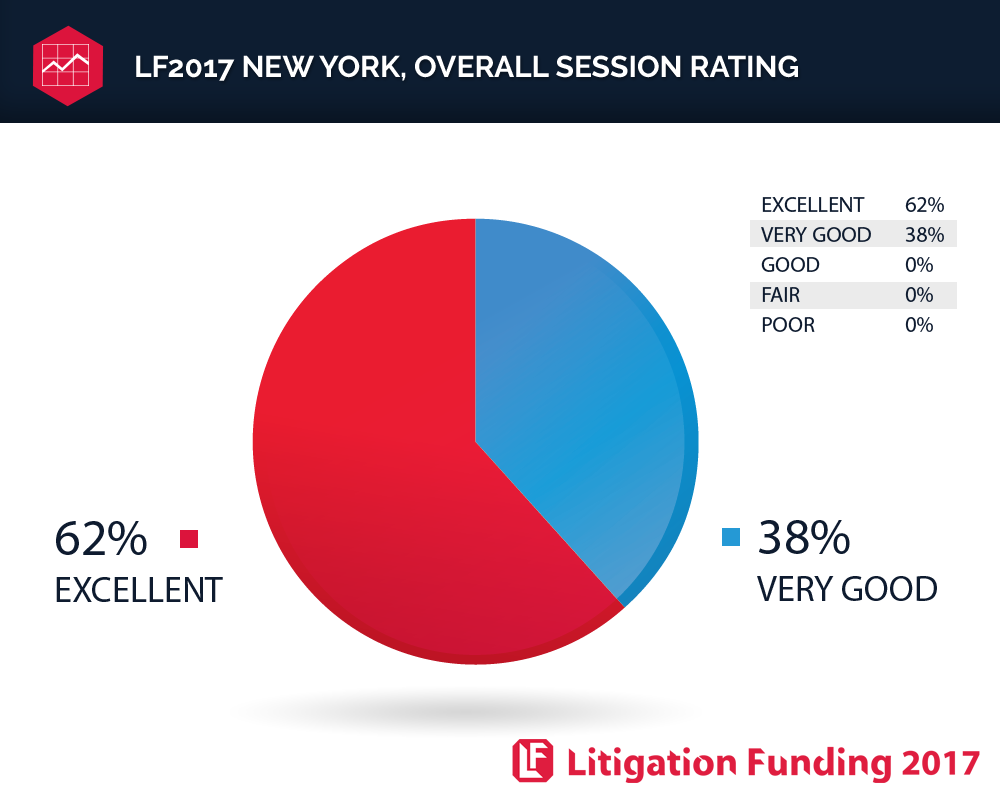
Below is a chart of the overall delegate voted session ratings of lectures at iDate Agency Convention.
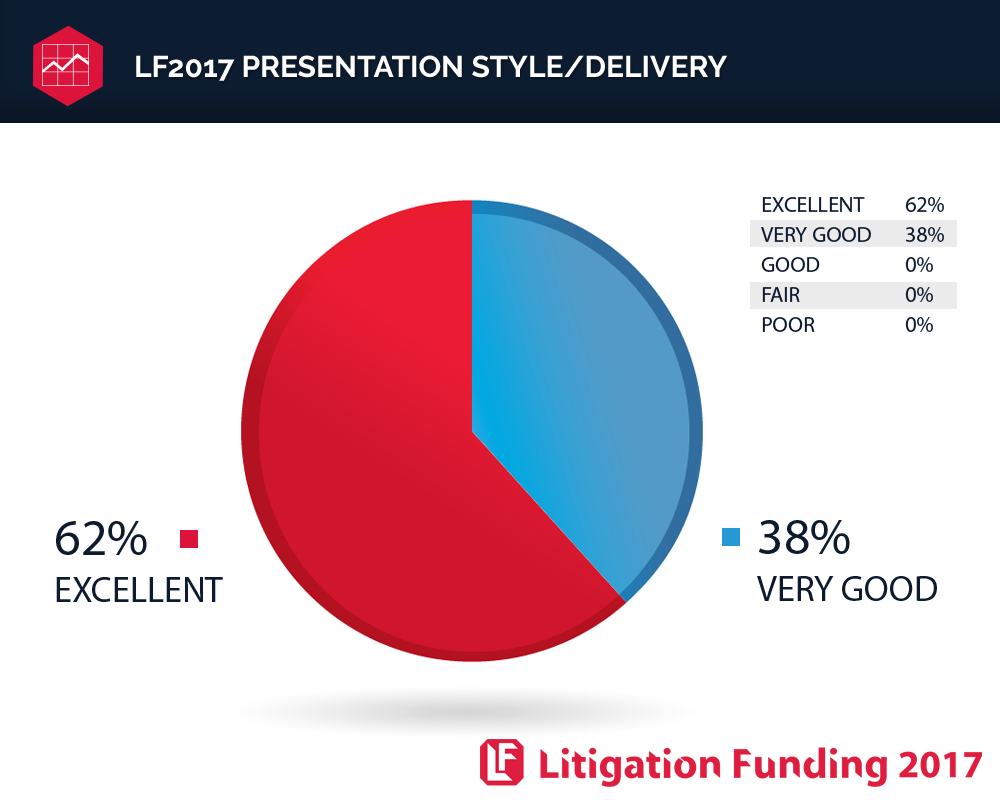
Below is a comparison chart of the speaker presentation & style ratings voted by delegates at the iDate Agency Convention.
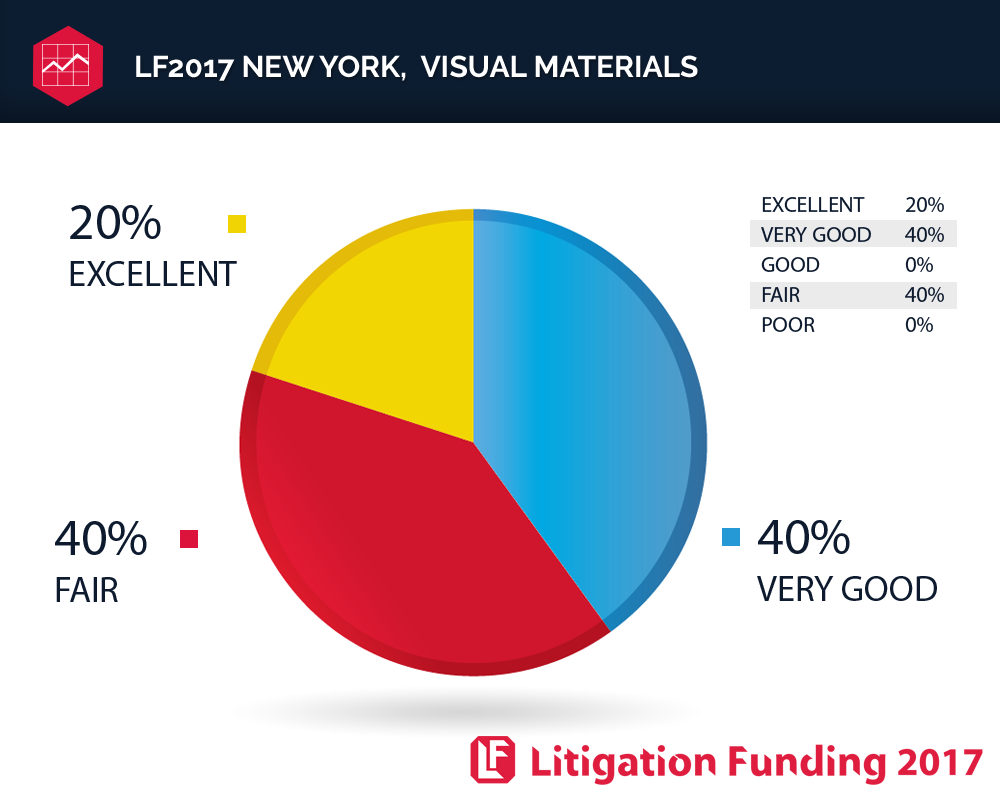
Below is a comparison chart of the visual materials voted by delegates at the iDate Agency Convention.
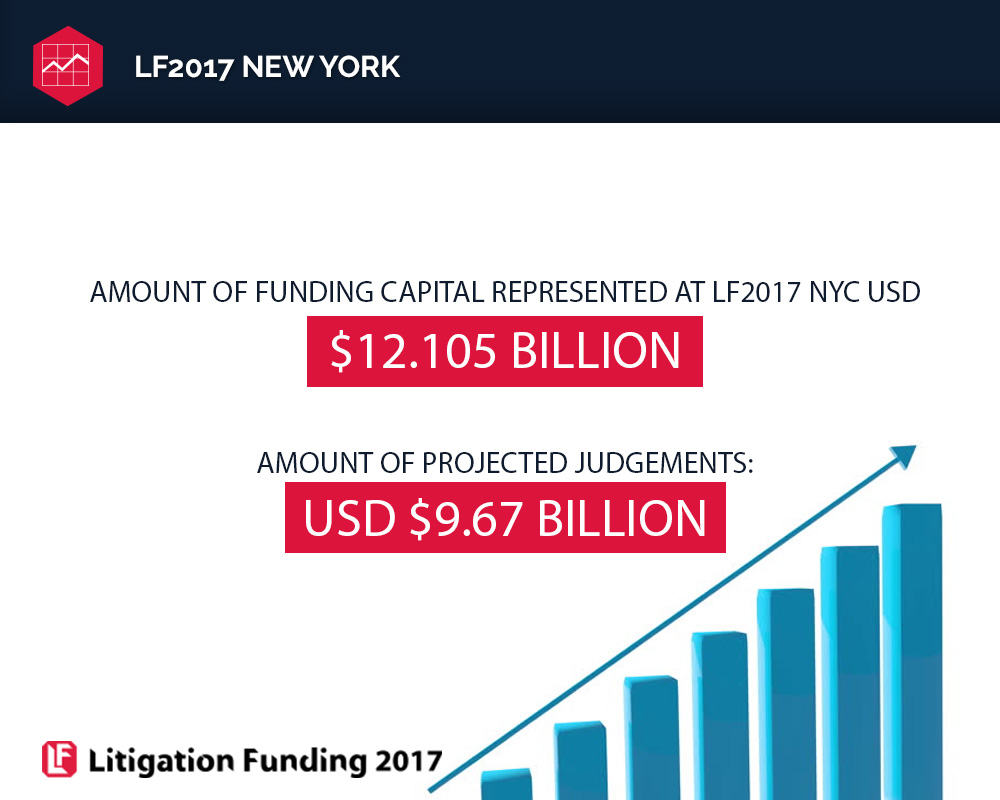
Below is a comparison chart of the Amounts of Funding Capital Represented & Projected Judgements for iDate Agency Convention.
Note: The distribution is fairly consistent at all iDate Agency Convention events.
Below is a chart that shows the distribution of title/position of delegates that have historically attended iDate Agency Conventions. The vast majority of delegates are senior executives from the firms they represent.
Note: The distribution is fairly consistent at all iDate Agency Convention events.
Below is a chart that shows the types of delegates that have historically attended iDate Agency Conventions.
Note: The distribution is fairly consistent at all iDate Agency Convention events.
Below is a chart that shows the iDate Agency Convention overview based on delegates' feedback.
Note: The distribution is fairly consistent at all iDate Agency Convention events.
Below is a comparison chart of the delegate expectations and recommendations from iDate Agency Convention in New York (2017).
Below is a comparison chart of the coverage of the subject matter voted by delegates at iDate Agency Convention in New York 2017.
Below is a comparison chart of the speaker knowledge ratings voted by delegates at iDate Agency Convention, New York.
Below is a chart of the overall delegate voted session ratings of lectures at iDate Agency Convention.
Below is a comparison chart of the speaker presentation & style ratings voted by delegates at the iDate Agency Convention.
Below is a comparison chart of the visual materials voted by delegates at the iDate Agency Convention.
Below is a comparison chart of the Amounts of Funding Capital Represented & Projected Judgements for iDate Agency Convention.


